GR static and GR toxic
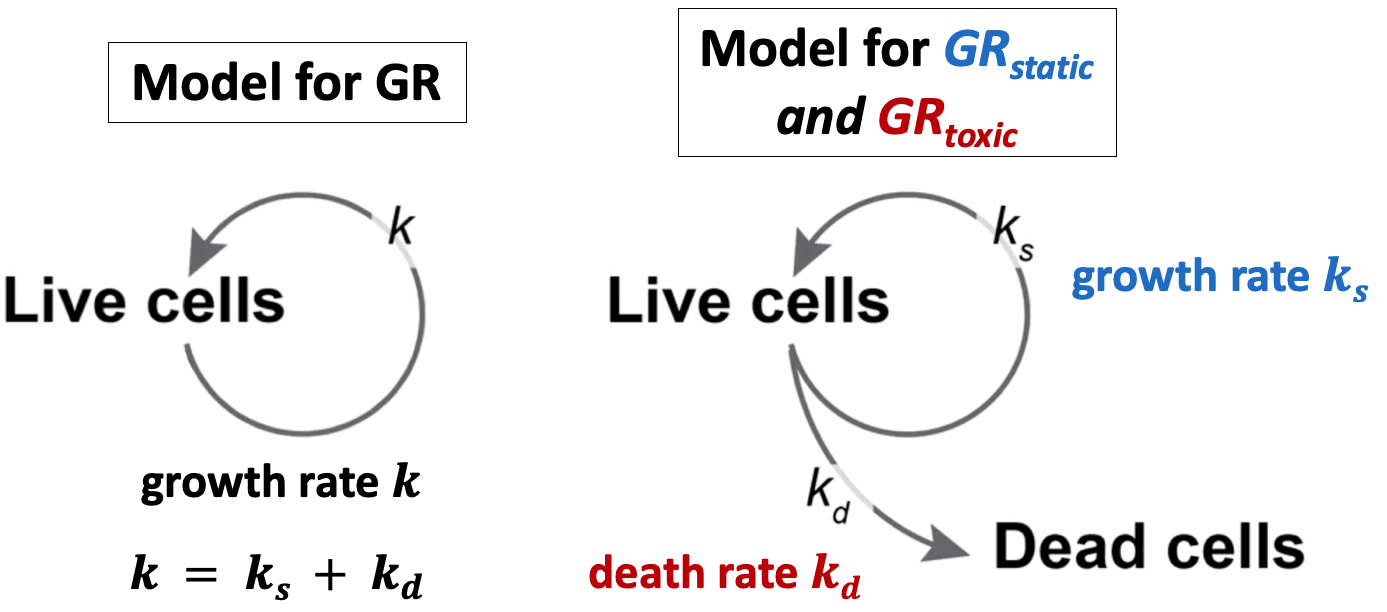
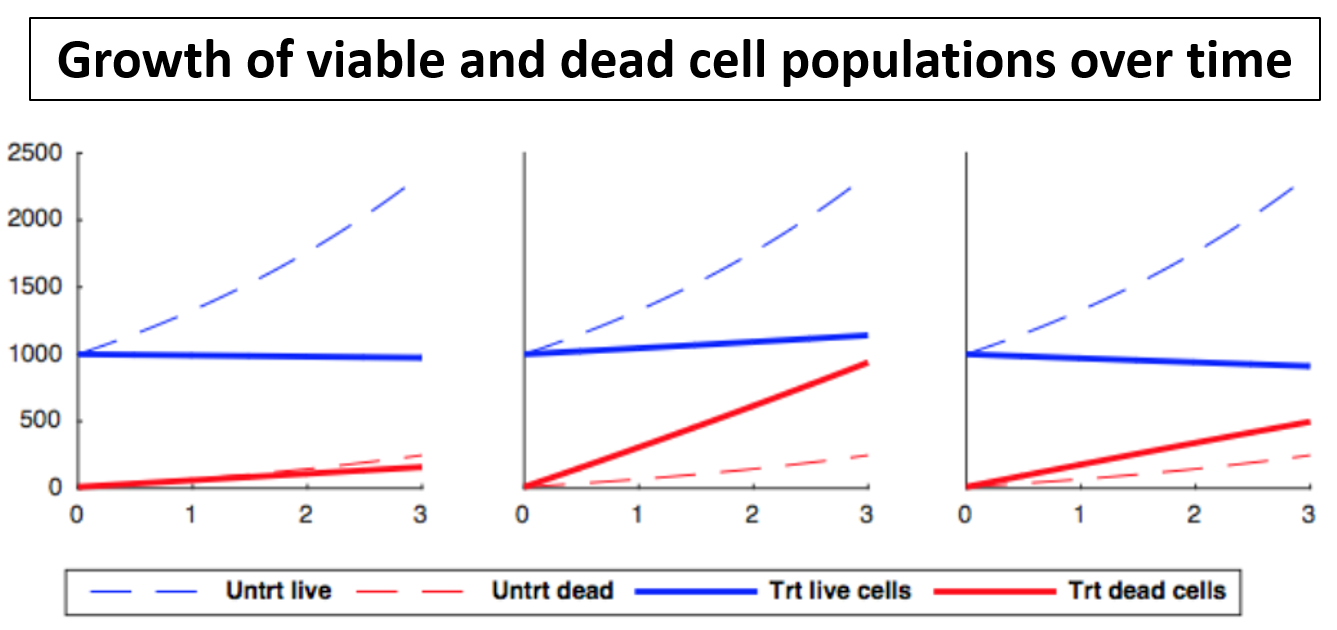
The original GR method detailed in Hafner et al. (2016) only takes into account living cells. However, when toxicity and cell death occurs, it may be informative to model this as well. To take this into account, we have extended our method for situations in which one has estimates of the number of dead cells as well as living cells. We separate the “GR” into two components: a static component GRstatic, which measures the how much viable cell growth rate is slowed compared to control, and a toxic component GRtoxic, which measures how much cell death rate is increased compared to control.
Definitions:
| Variable | Definition | Column title |
|---|---|---|
| x(c,t) | the amount of viable cells at time t at drug concentration c | cell_count |
| d(c,t) | the amount of dead cells at time t at drug concentration c | dead_cell_count |
| x0 = x(0,0) | the starting amount of viable cells | cell_count__time0 |
| d0 = d(0,0) | starting amount of dead cells | dead_cell_count__time0 |
| xctrl = x(0,t) | amount of un-treated viable cells at time t | cell_count__ctrl |
| dctrl = d(0,t) | amount of dead un-treated cells at time t | dead_cell_count__ctrl |
| ks(c,t) | the “cytostatic” growth-rate of the cell population, i.e. the rate of change of viable cells, for treatment concentration c at time t | |
| kd(c,t) | the “cytotoxic” growth-rate of the cell population, i.e. the rate of change of dead cells, for treatment concentration c at time t | |
| k(c,t) = ks(c,t) + kd(c,t) | the overall growth-rate of the cell population for treatment concentration c at time t | |
| t | the duration of the assay in hours |
Overview:
In order to differentiate between the effects of slowed growth and toxicity, we introduce the static and toxic GR. We start by modifying our model of cell population growth to separate total population growth into two parts, a growth rate ks and a death rate kd.
To derive these, we describe the rates of change with a system of ordinary differential equations (ODEs):
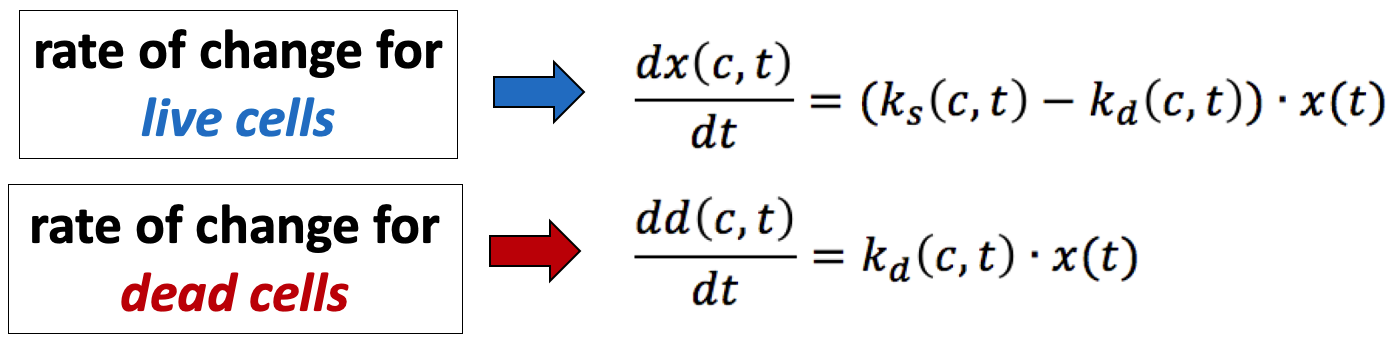
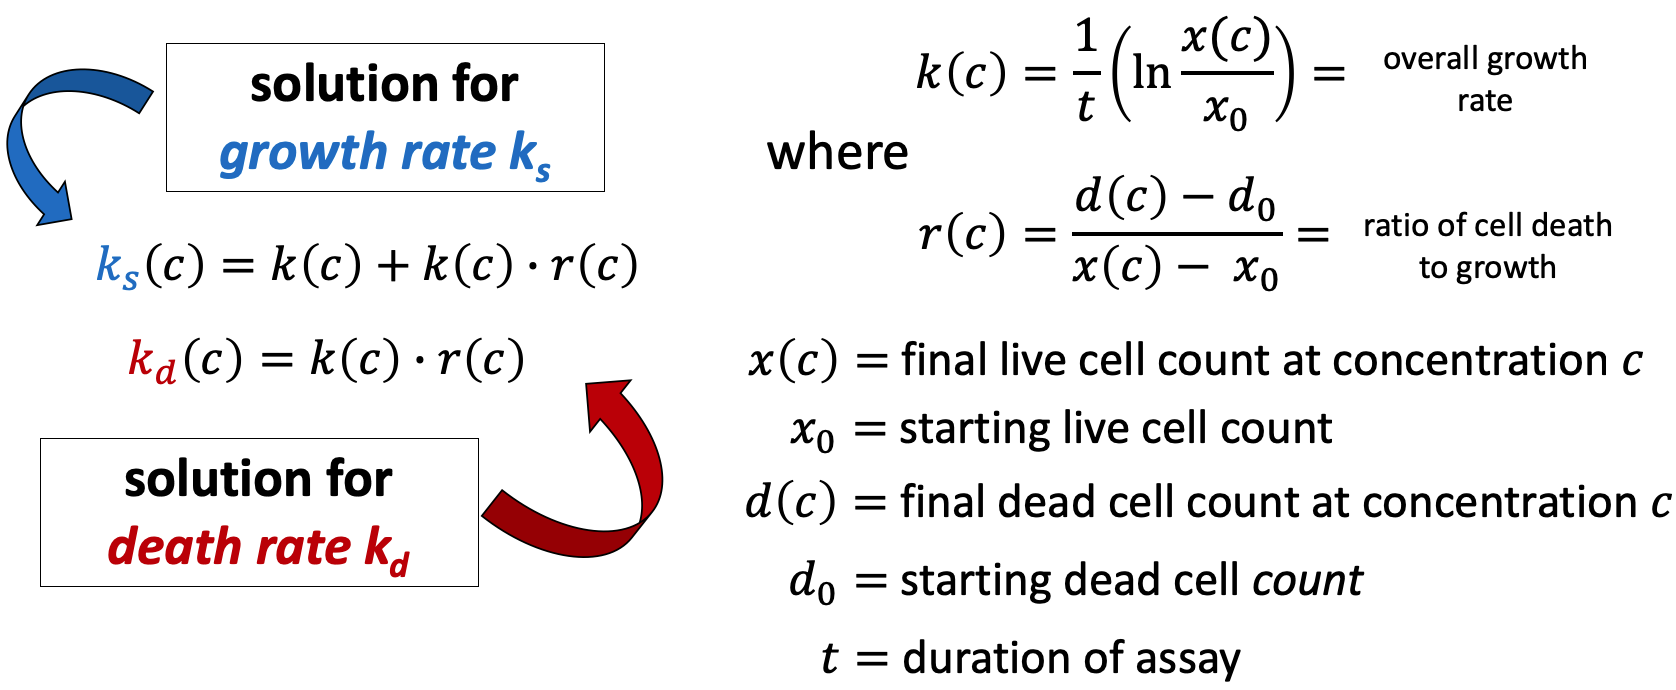
Using the initial conditions for the population of live cells x0 = x(0,0) and dead cells d0 = d(0,0), we solve this system for ks and kd.
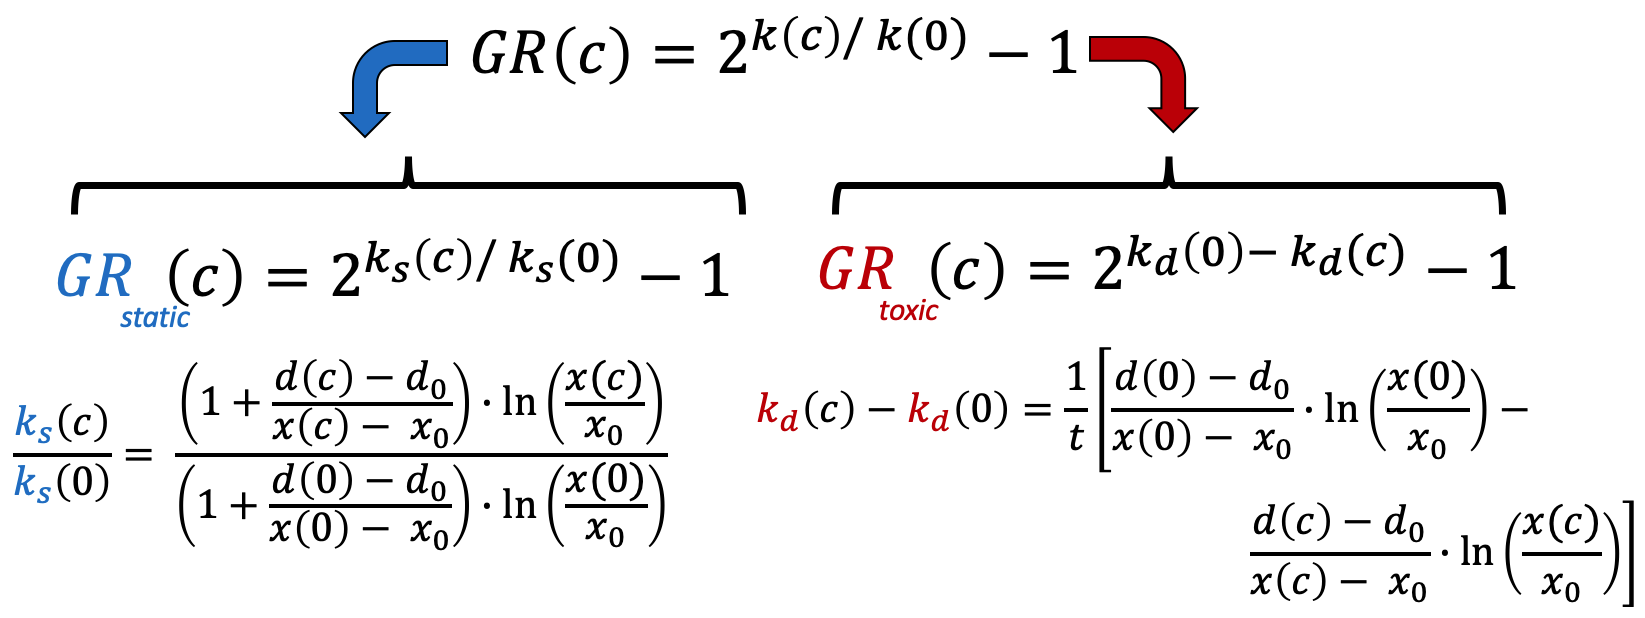
For GRstatic, the cytostatic part of growth-rate inhibition, we consider the ratio of the treated growth-rate among viable cells to the un-treated growth rate ks(c)/ks(0). Again, we exponentiate it and subtract 1 to bound our values for the curve. Since GRstatic only characterizes slowed population growth and not cell death, it is bounded between 1 and 0.
For GRtoxic, we expect the un-treated death rate kd(0) to be close to zero, so to make a more robust measure we use the difference of the death rates kd(c) - kd(0) rather than their ratio. As with GRstatic, we exponentiate and subtract 1. This makes it so that GRtoxic is bounded between 0 and -1.
As with the original GR method, we fit logistic curves to model the GRstatic and GRtoxic values as a function of the log treatment concentration.
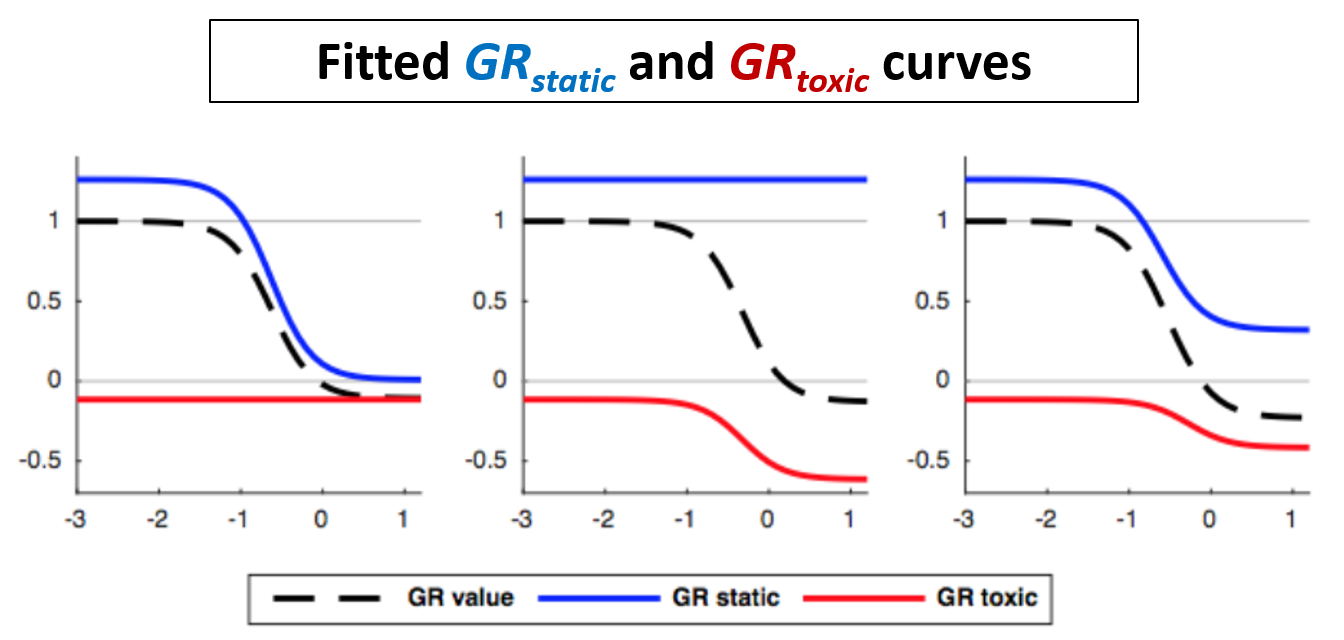
As with the original GR curves, we extract summary metrics from the GRstatic and GRtoxic curves such as GR50, GRinf, GRAOC, etc. These metrics summarize the growth response of the viable and dead cell populations, respectively.
All of these parameters are defined in the same was as for the original GR curves, with a few small changes. Since the GRtoxic curve is bounded between 0 and -1, its GR50 is defined as the concentration at which it crosses the y = -0.5 line. Similarly, it's GRAOC value is defined as the area above the curve, but below zero.