Overview
The “Dye Drop” and “Deep Dye Drop” assays (Mills et al., 2022) are minimally disruptive, customizable assays that use sequential density displacement to collect multiplexed data at low-cost with high reproducibility.
Dye drop consists of:
1. Wet-lab experiment 2. Imaging samples 3. Extracting image data
We describe several different ways to implement Dye Drop assays to obtain detailed cell viability and cell cycle phenotypes that are often obscured by population-average assays.
Experimental Methods
Dye Drop
Dye drop uses a sequence of solutions where each solution is made slightly denser than the last by addition of iodixanol (OptiPrepTM), an inert liquid used in radiology. The denser solutions flow to the bottom of the well, displacing the previous solution with high efficiency and minimal mixing. This eliminates the need for pre-fixation mix and wash steps, where most of the experimental variability and uneven cell loss occurs.
 Cells plated in 384-well plates (a single well is depicted) are exposed to different perturbagens for a set amount of time and then stained with Hoechst (to label all nuclei) and a LIVE/DEAD dye (to label dead cells) prepared in solution with OptiPrepTM. Cells are then fixed by layering in a denser solution containing formaldehyde and more OptiPrepTM to the wells.
Deep dye drop
Deep Dye Drop incorporates EdU and antibody-based staining to gain detailed cell cycle data.
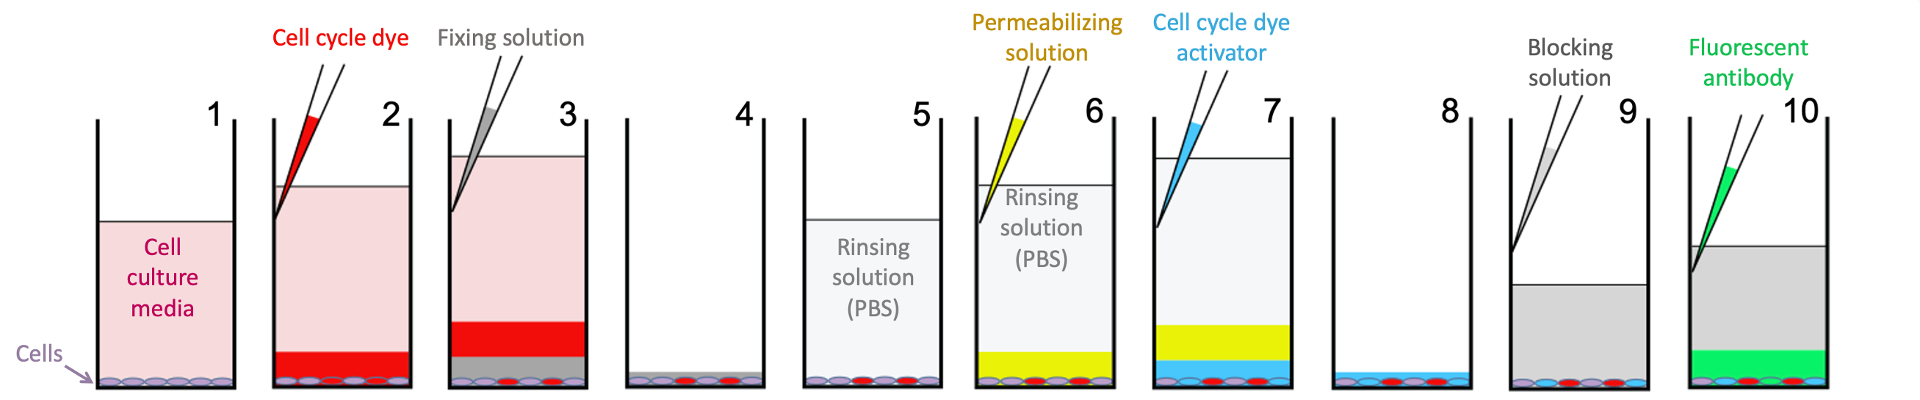 Cells are plated and treated as above, they are then incubated with a LIVE/DEAD dye and EdU (incorporated into newly synthesized DNA by cells in S-phase) prepared in solution with OptiPrepTM, and fixed as above. Cells are then permeabilized to facilitate antibody staining, blocked to prevent non-specific antibody binding, EdU is labeled with a fluorescent dye, cells are stained with a phospho-histone H3 antibody (to identify M-phase cells) and Hoechst (to label all nuclei and measure DNA content) overnight.
See the Experimental Protocol section for more details.
Resulting Images
The stained cells are then imaged on a fluorescent microscope.
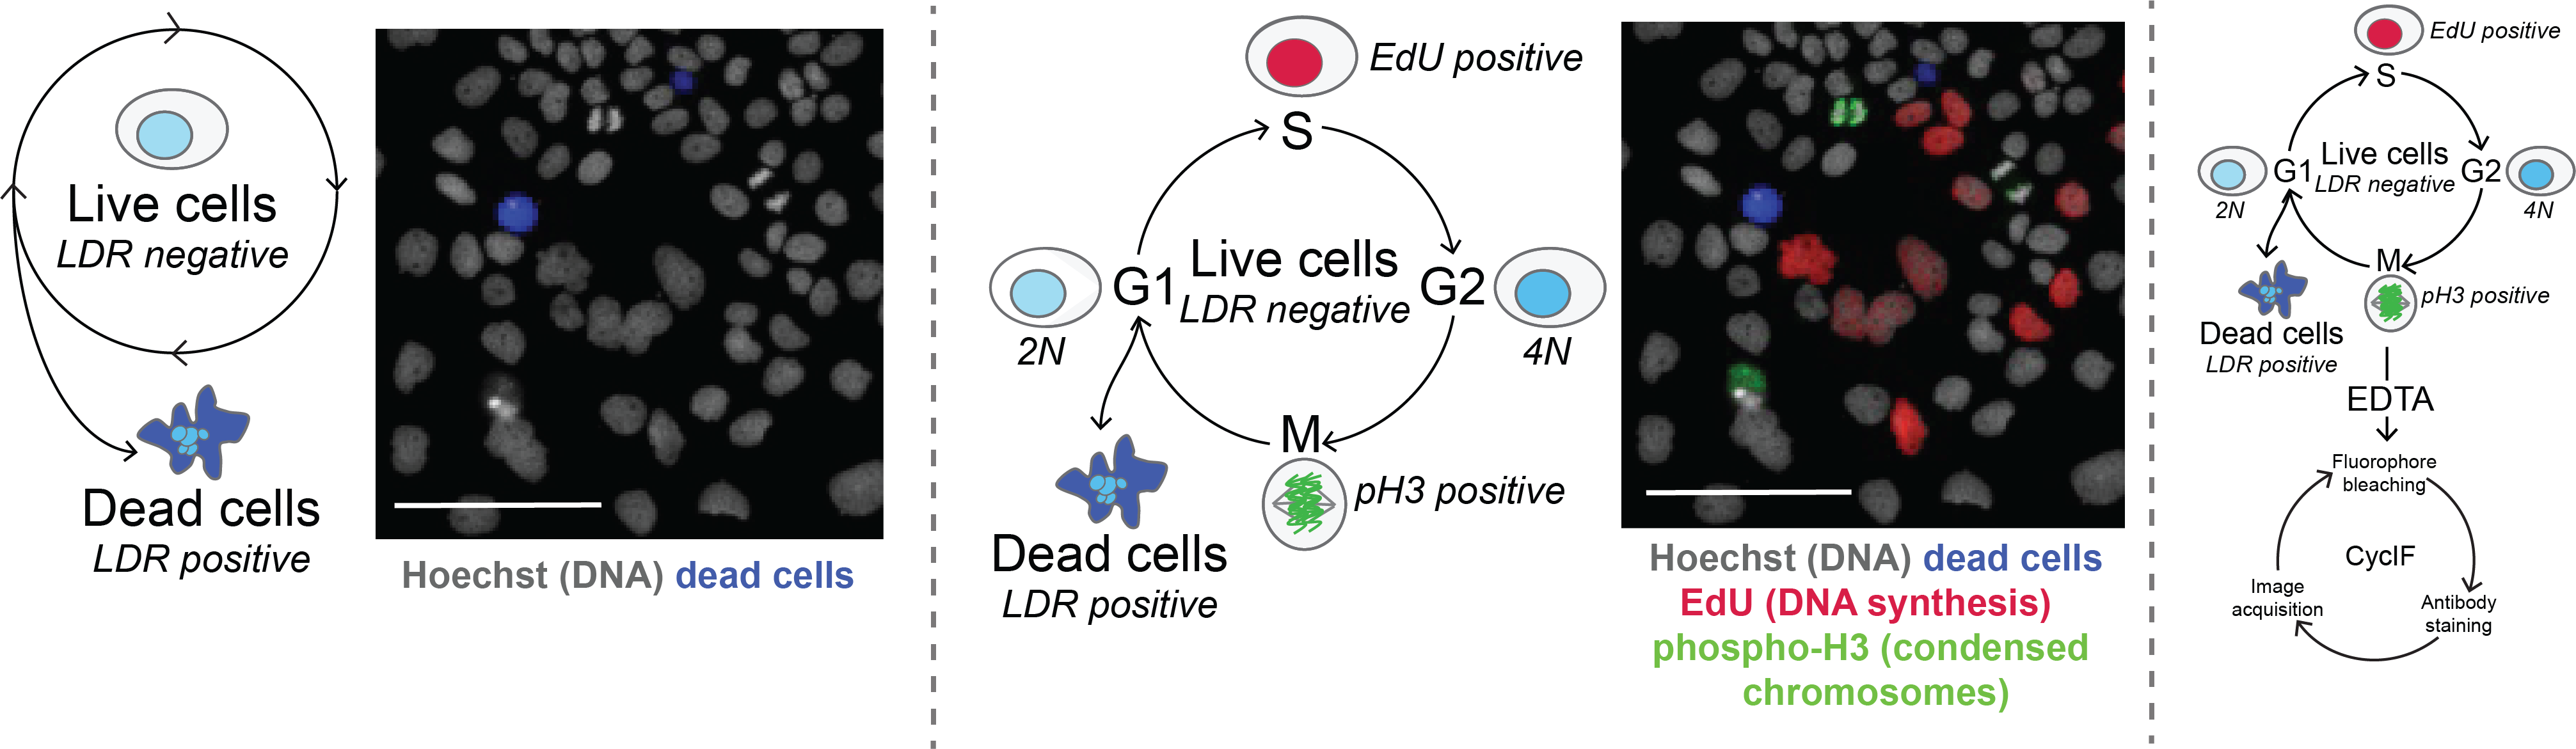
This sample was stained with 4 common markers:
- Hoechst, a molecule that binds the minor groove of double stranded DNA is used to visualize nuclei and measure DNA content
- EdU, a molecule that is incorporated into newly synthesized DNA while cells are in S-phase
- LIVE/DEAD red (LDR), a stain that penetrates the disrupted cell membrane and binds intracellular amines in dead cells
- pH3 (phospho-histone H3), a protein that is phosphorylated during the chromosomal condensation of M-phase
Deep dye drop can also be combined with multiplexed imaging methods like CyCIF to yield detailed molecular and spatial information.
Extracting cell cycle information
Live / Dead cells
Using Hoechst and LDR, cells that have high LDR signal and/or low DNA content are counted as dead cells.
M-Phase
Cells that have high pH3 signal are counted as M-phase cells.
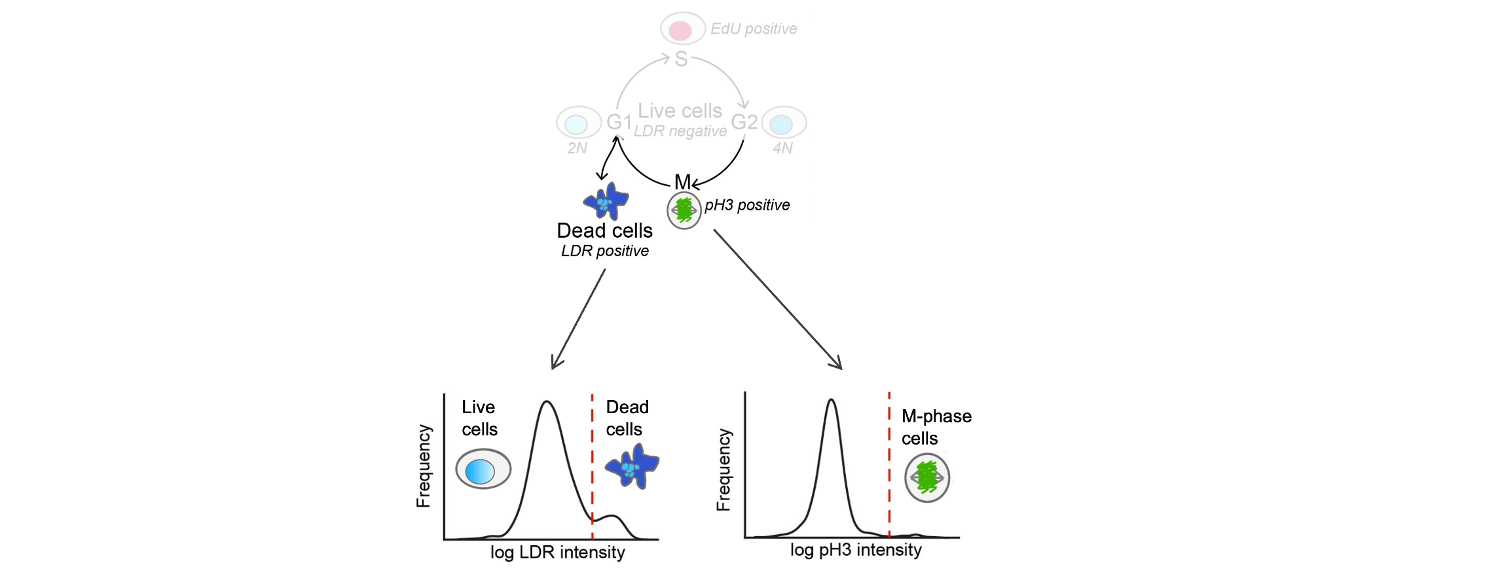 Examples of how cells are classified as live or dead (left) or in M-phase (right).
S-Phase
Cells in S-phase have high EdU signal.
G1/G2
EdU negative cells are classified as G1, G2 or S-phase dropout (S_dropout) based on their DNA content (integrated Hoechst intensity). G2 cells have duplicated DNA content relative to G1 cells, and cells with intermediate DNA content are classified as S_dropout.
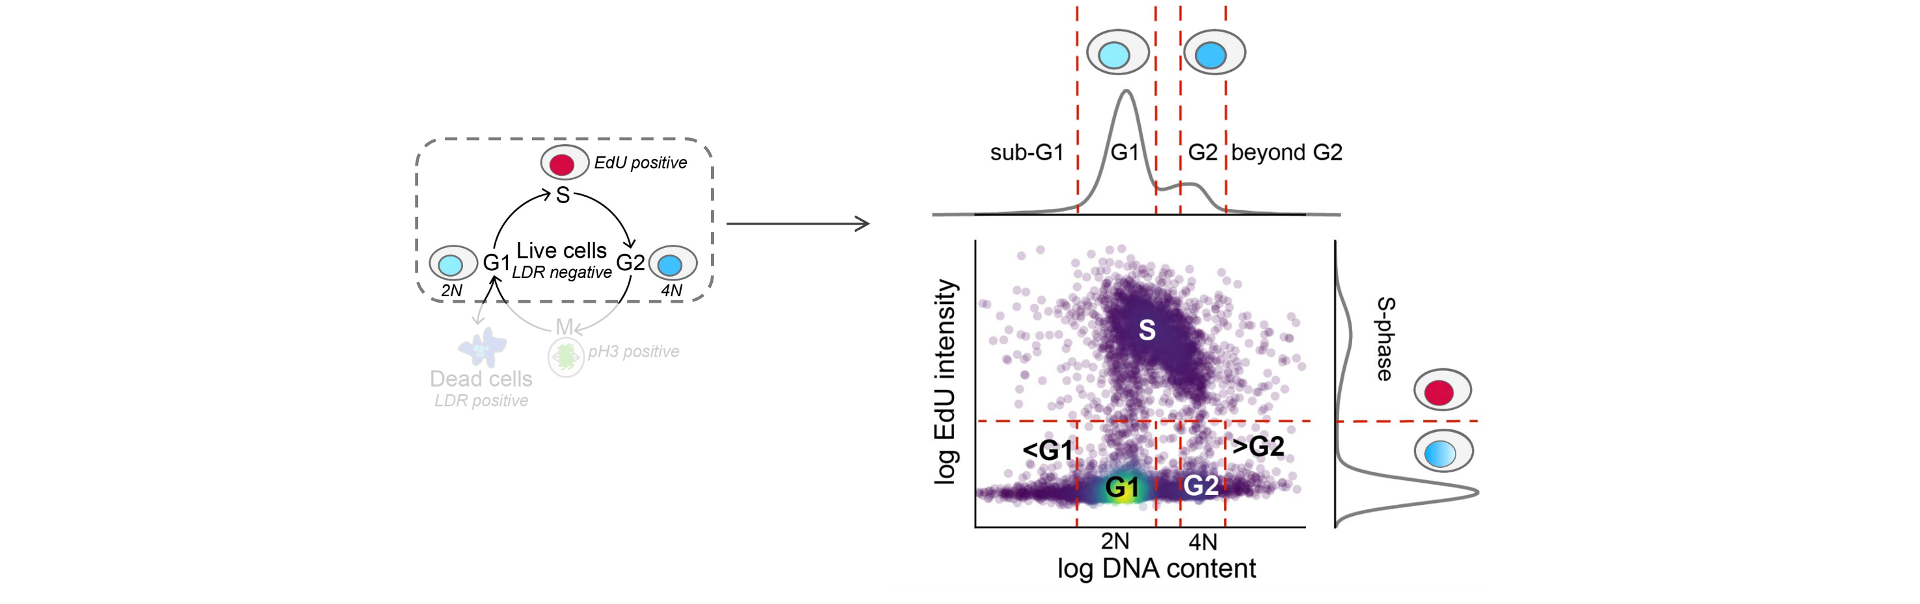 Example of how cells are classified into G1-, G2-, or S-phases.
See the Computational Method section for more details.
Growth Rate Metrics
Dye Drop methods are an ideal complement to the growth-rate (GR) inhibition method of computing dose responses that allows for the comparison of drug effects across cell lines with varied doubling times.
Cell viability data obtained from Dye Drop can be fed into the GR calculator to determine the GR value for a given treatment compared to an untreated control.
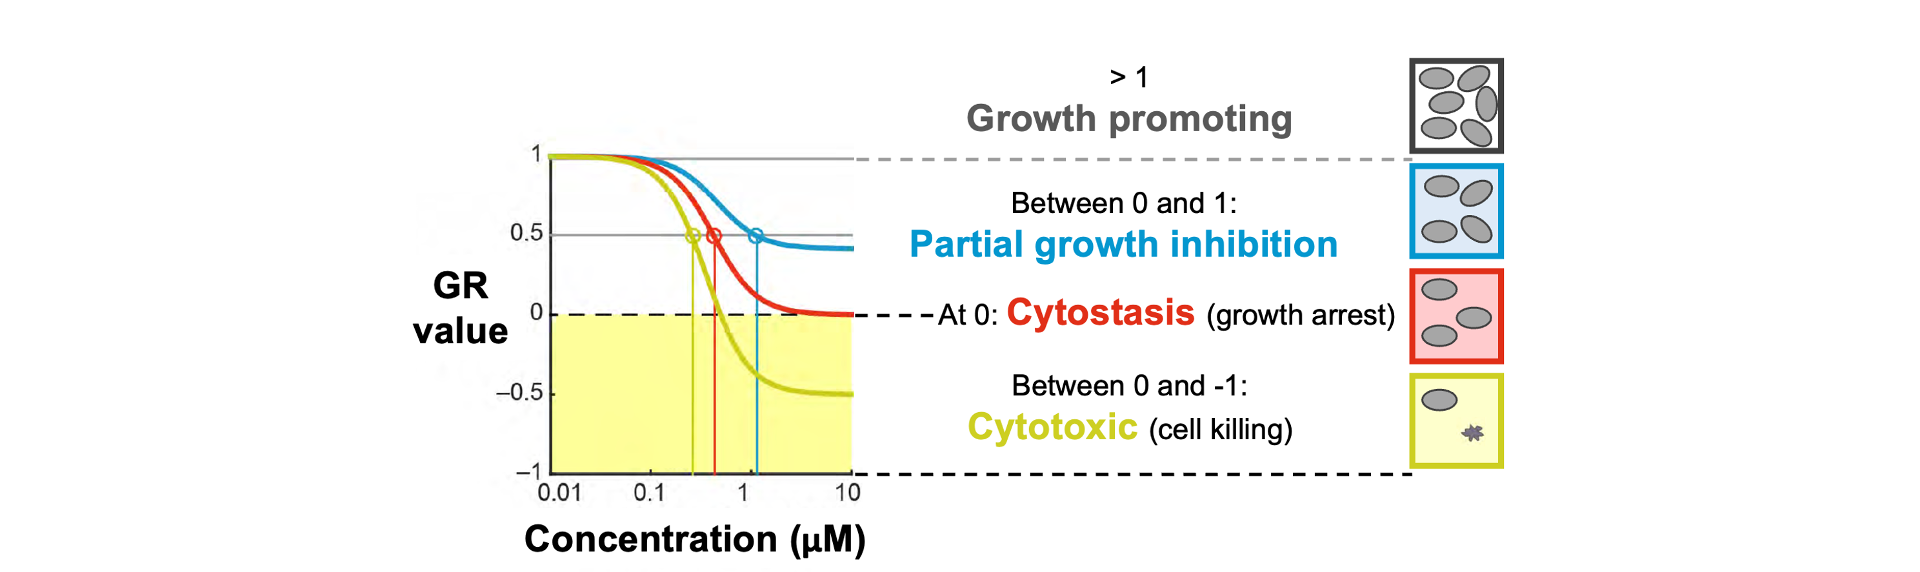 Graph depicting how growth rate values correspond to cell growth metrics.
Growth Rate Metrics - Cytostatic and Cytotoxic Components
See GR Metrics for more details on calculating GR values and metrics.
Applying Dye Drop at scale
This example is part of a large-scale dataset generated by using Dye Drop on a panel of 58 breast cancer cells treated with 67 kinase inhibitors - read more in Mills et al., 2022, and interact with the dataset here.
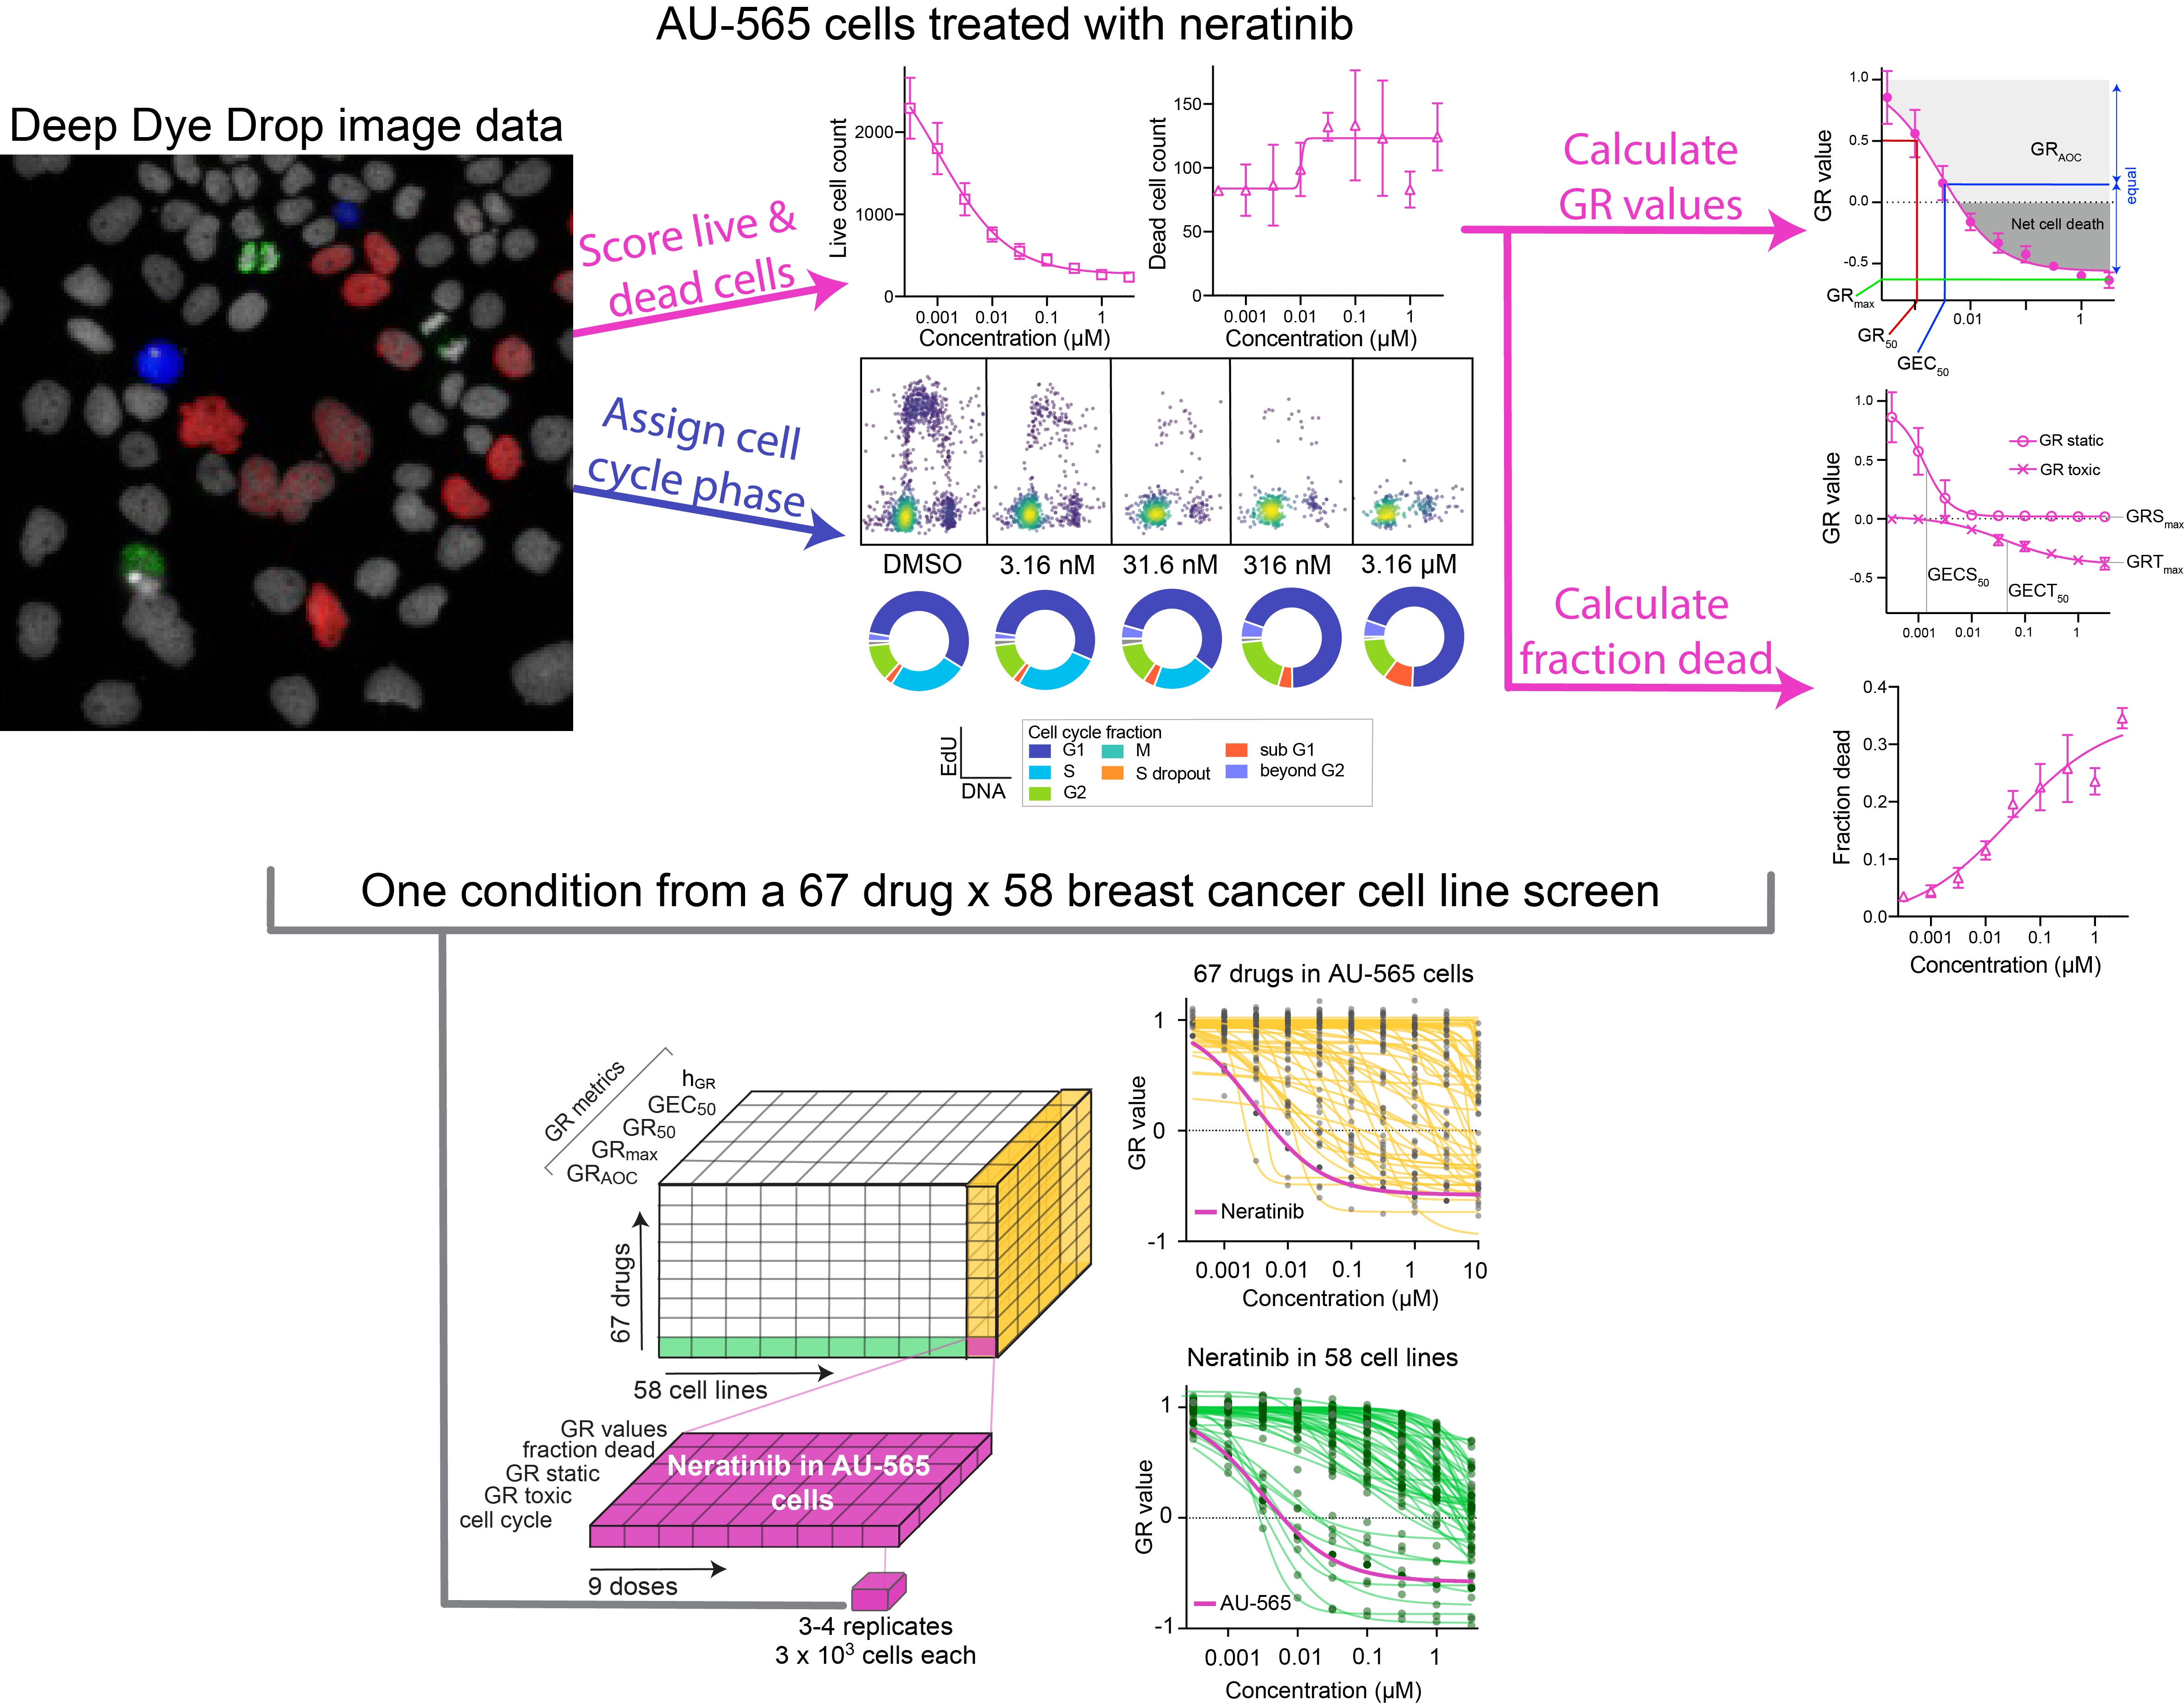 In this overview, AU-565 cells treated with neratinib are highlighted. For each concentration tested, cells are classified as live or dead, the live cells are then assigned to the phases of the cell cycle based on their DNA content, and EdU and phospho-histone H3 intensities. The cell counts are used to calculate GR values, the associated GR static and GR toxic values, and the fraction of dead cells. This cell line - drug pair represents one set of measurements out of a 58 cell line, 67 drug dye drop profiling effort.