Growth rate (GR) metrics
Definitions:
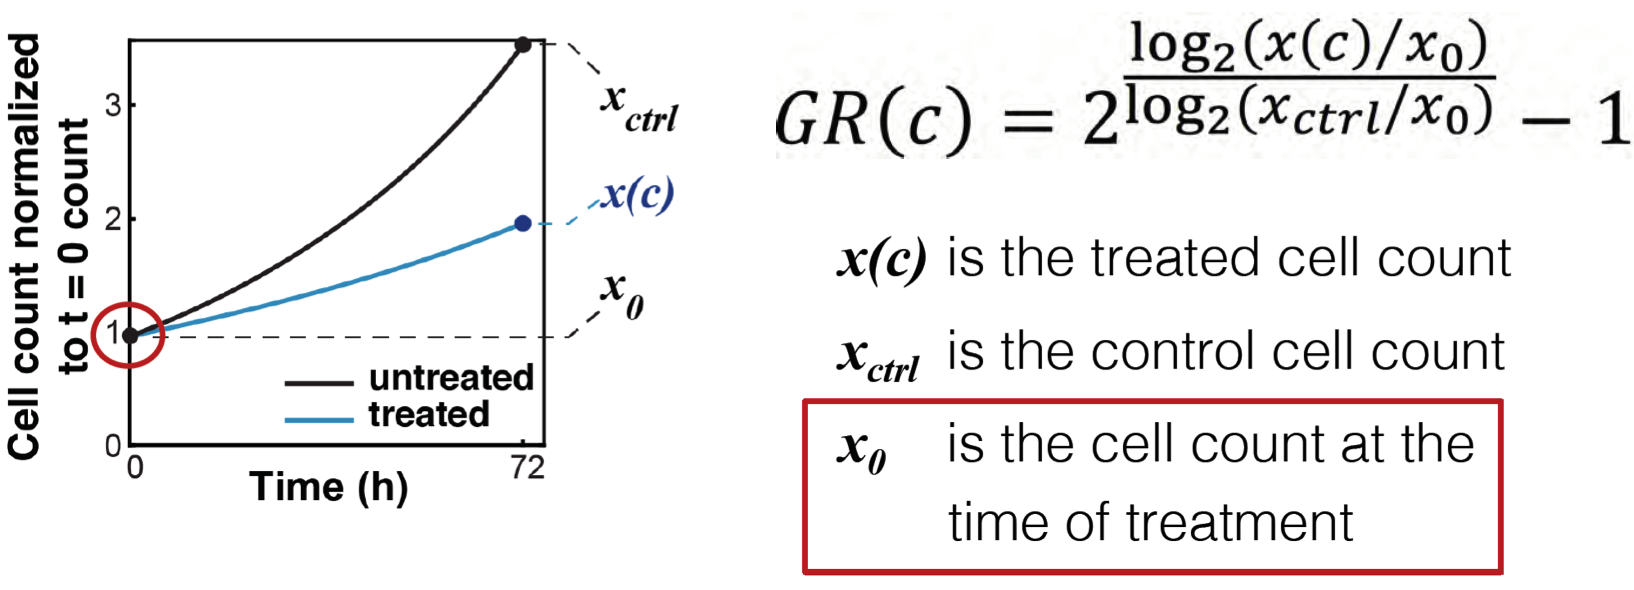
- x(c,t) = the amount of viable cells at time t at drug concentration c (column: cell_count)
- x0 = x(0,0) = starting amount of viable cells (column: cell_count__time0)
- xctrl = x(0,t) = amount of un-treated viable cells at time t (column: cell_count__ctrl)
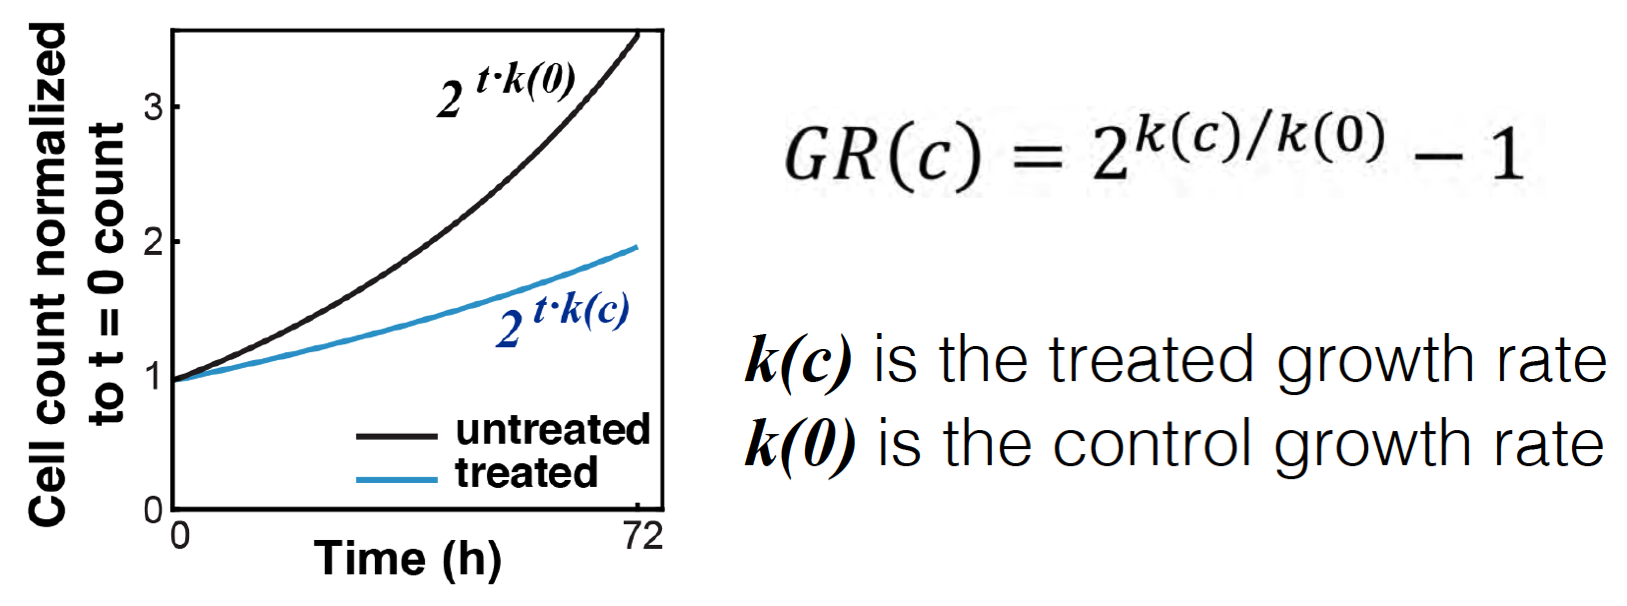
- k(0) = the average growth-rate of untreated cells throughout the experiment
- k(c) = the average growth-rate of treated cells throughout the experiment
- GR(c) = 2^[ k(c)/k(0) ] - 1 = the growth-rate inhibition value (GR value) of a given treatment at concentration c
Overview:
Briefly, the growth-rate inhibition is given by the ratio of the growth-rate of the treated cells k(c) to that of the untreated cells k(0). We normalize this ratio by exponentiating it and subtracting one so that it falls between -1 and 1 for growth-inhibiting and cytotoxic treatments.
Because it is difficult to measure the growth-rate at any one time, we use the starting population and endpoint measures to estimate the average growth-rate throughout the experiment. Using the definitions above, we can calculate the growth-rate of the un-treated control as
k(0) = (1/t)log2(xctrl/x0)
and the growth-rate of the treated cells as
k(c) = (1/t)log2(x(c)/x0)
giving the formula for the GR value
GR(c) = 2^[ k(c)/k(0) ] - 1 = 2^[ log2(x(c)/x0) / log2(xctrl/x0) ] - 1</sub>
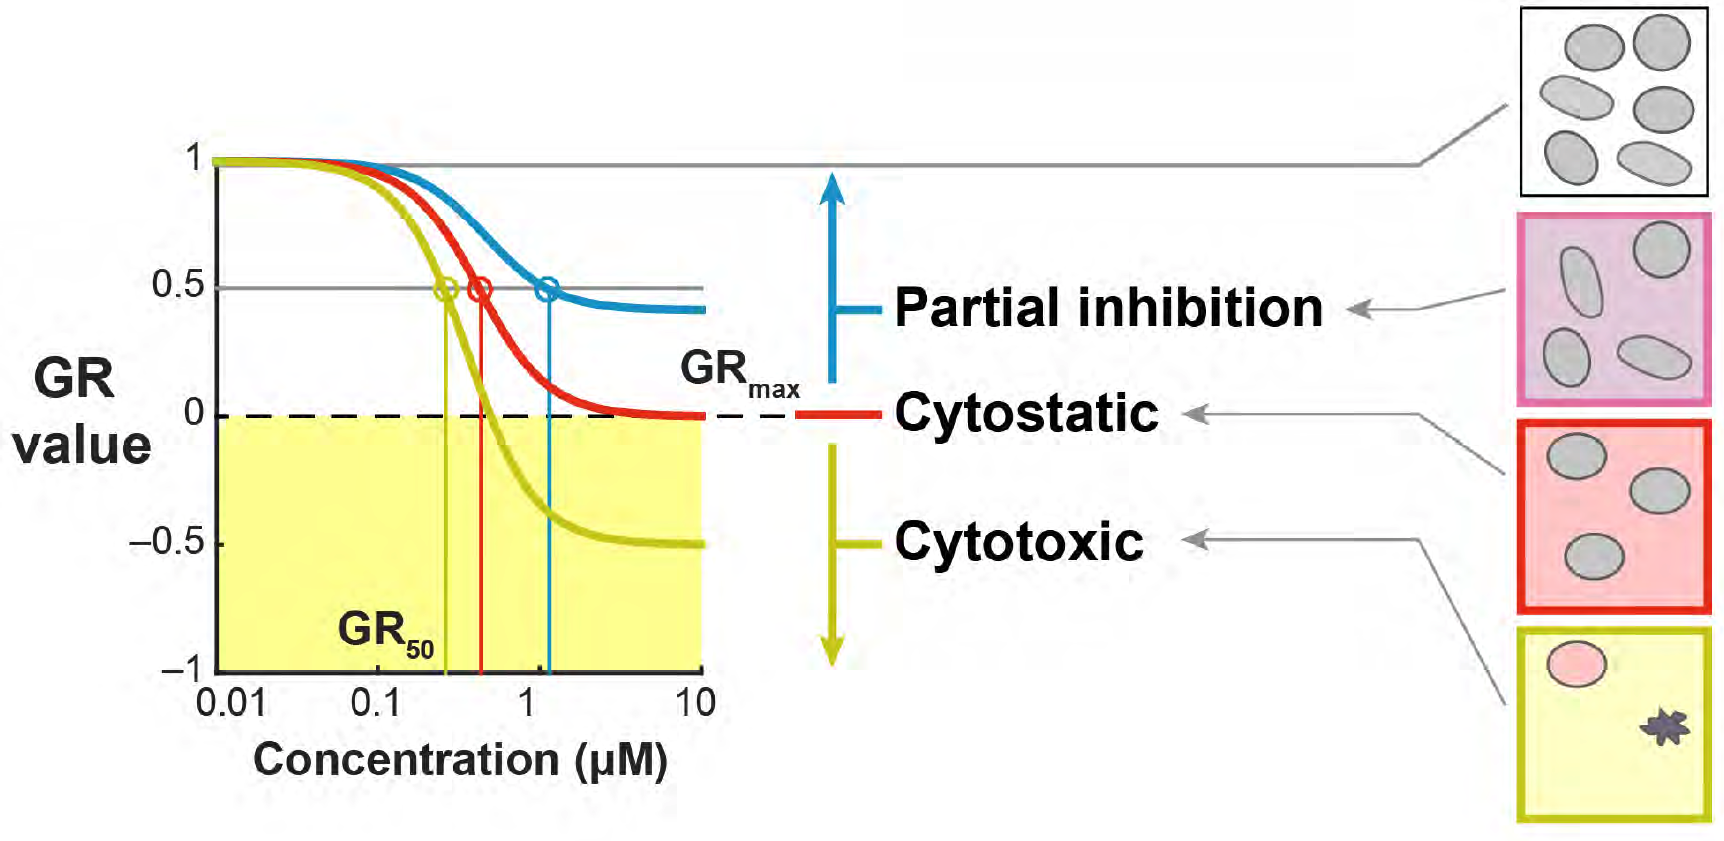
The GR value relates naturally to a treatment’s effects on cell population growth. For partially cytostatic treatments (where growth is slowed, but not completely halted) GR values fall between 1 and 0. A GR value of zero represents cytostasis, or completely halted population growth. Cytotoxic treatments (where cell population declines) produce GR values between 0 and -1. Finally, a GR value of greater than one signifies a treatment that promotes growth.
GR values are used to fit a logistic dose-response curve where the x-axis is the log treatment concentration. We constrain the upper asymptote of the curve to a value of 1 because we would expect no change in growth rate for extremely low concentrations. GR values greater than one are allowed, but we constrain the fitted curve to less than one since we focus on growth-inhibiting and cytotoxic treatments. For treatments that promote growth, and for treatments that poorly fit a logistic curve, we fit a flat horizontal line.
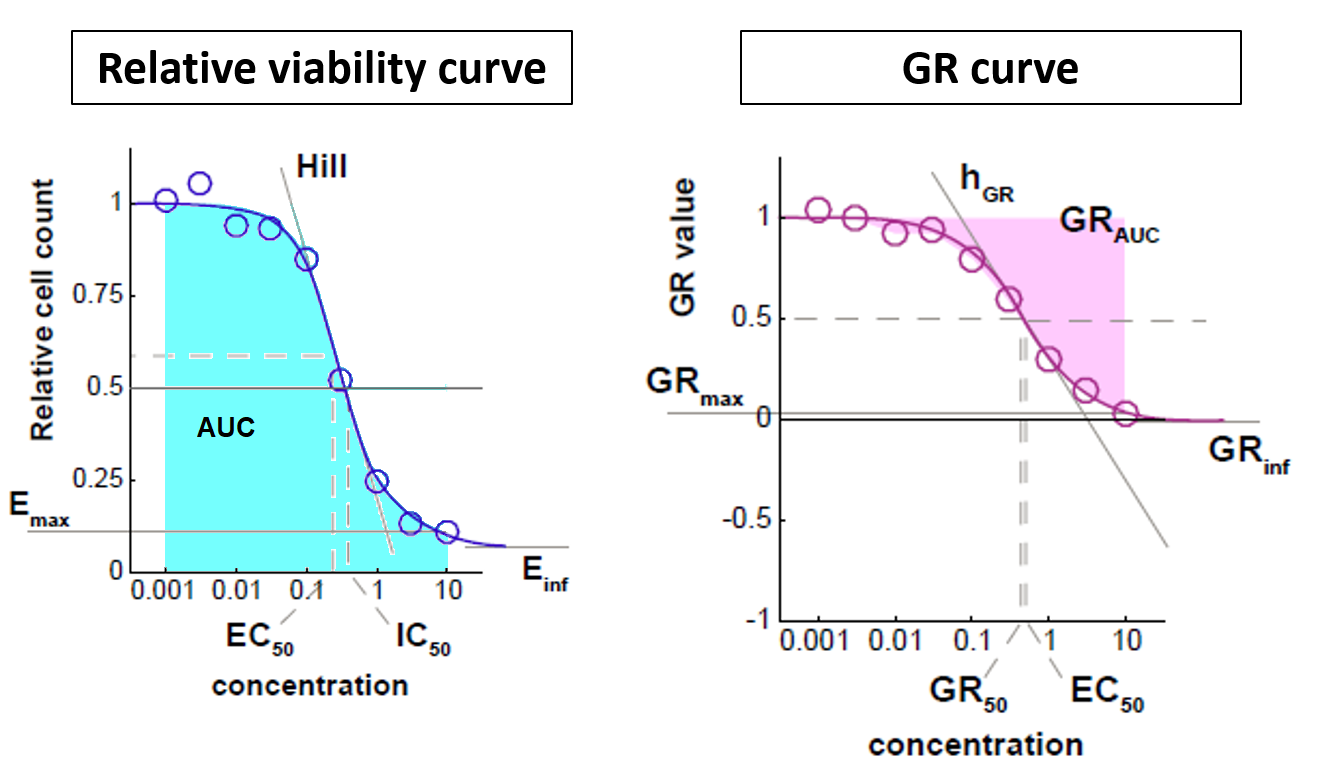
Just like percent viability curves, GR curves can be summarized by a number of metrics. In place of IC50, the measure of concentration that gives 50% relative viability, we report GR50, the concentration at which growth is reduced by 50% (where the GR curve intersects 0.5). In place of Einf, the lower asymptote of the relative viability curve (the maximal theoretical drug effect), we report GRinf, the lower asymptote of the GR curve. And so on.
Traditional summary statistics of the relative viability curve include
IC50, Einf, Emax,EC50, h (the Hill coefficient), and AUC (area under the curve).
We report analagous statistics for each GR curve
GR50, GRinf, GRmax, GEC50, hGR, and GRAOC (area over the GR curve).