Example Data Set
Human Normal Colon
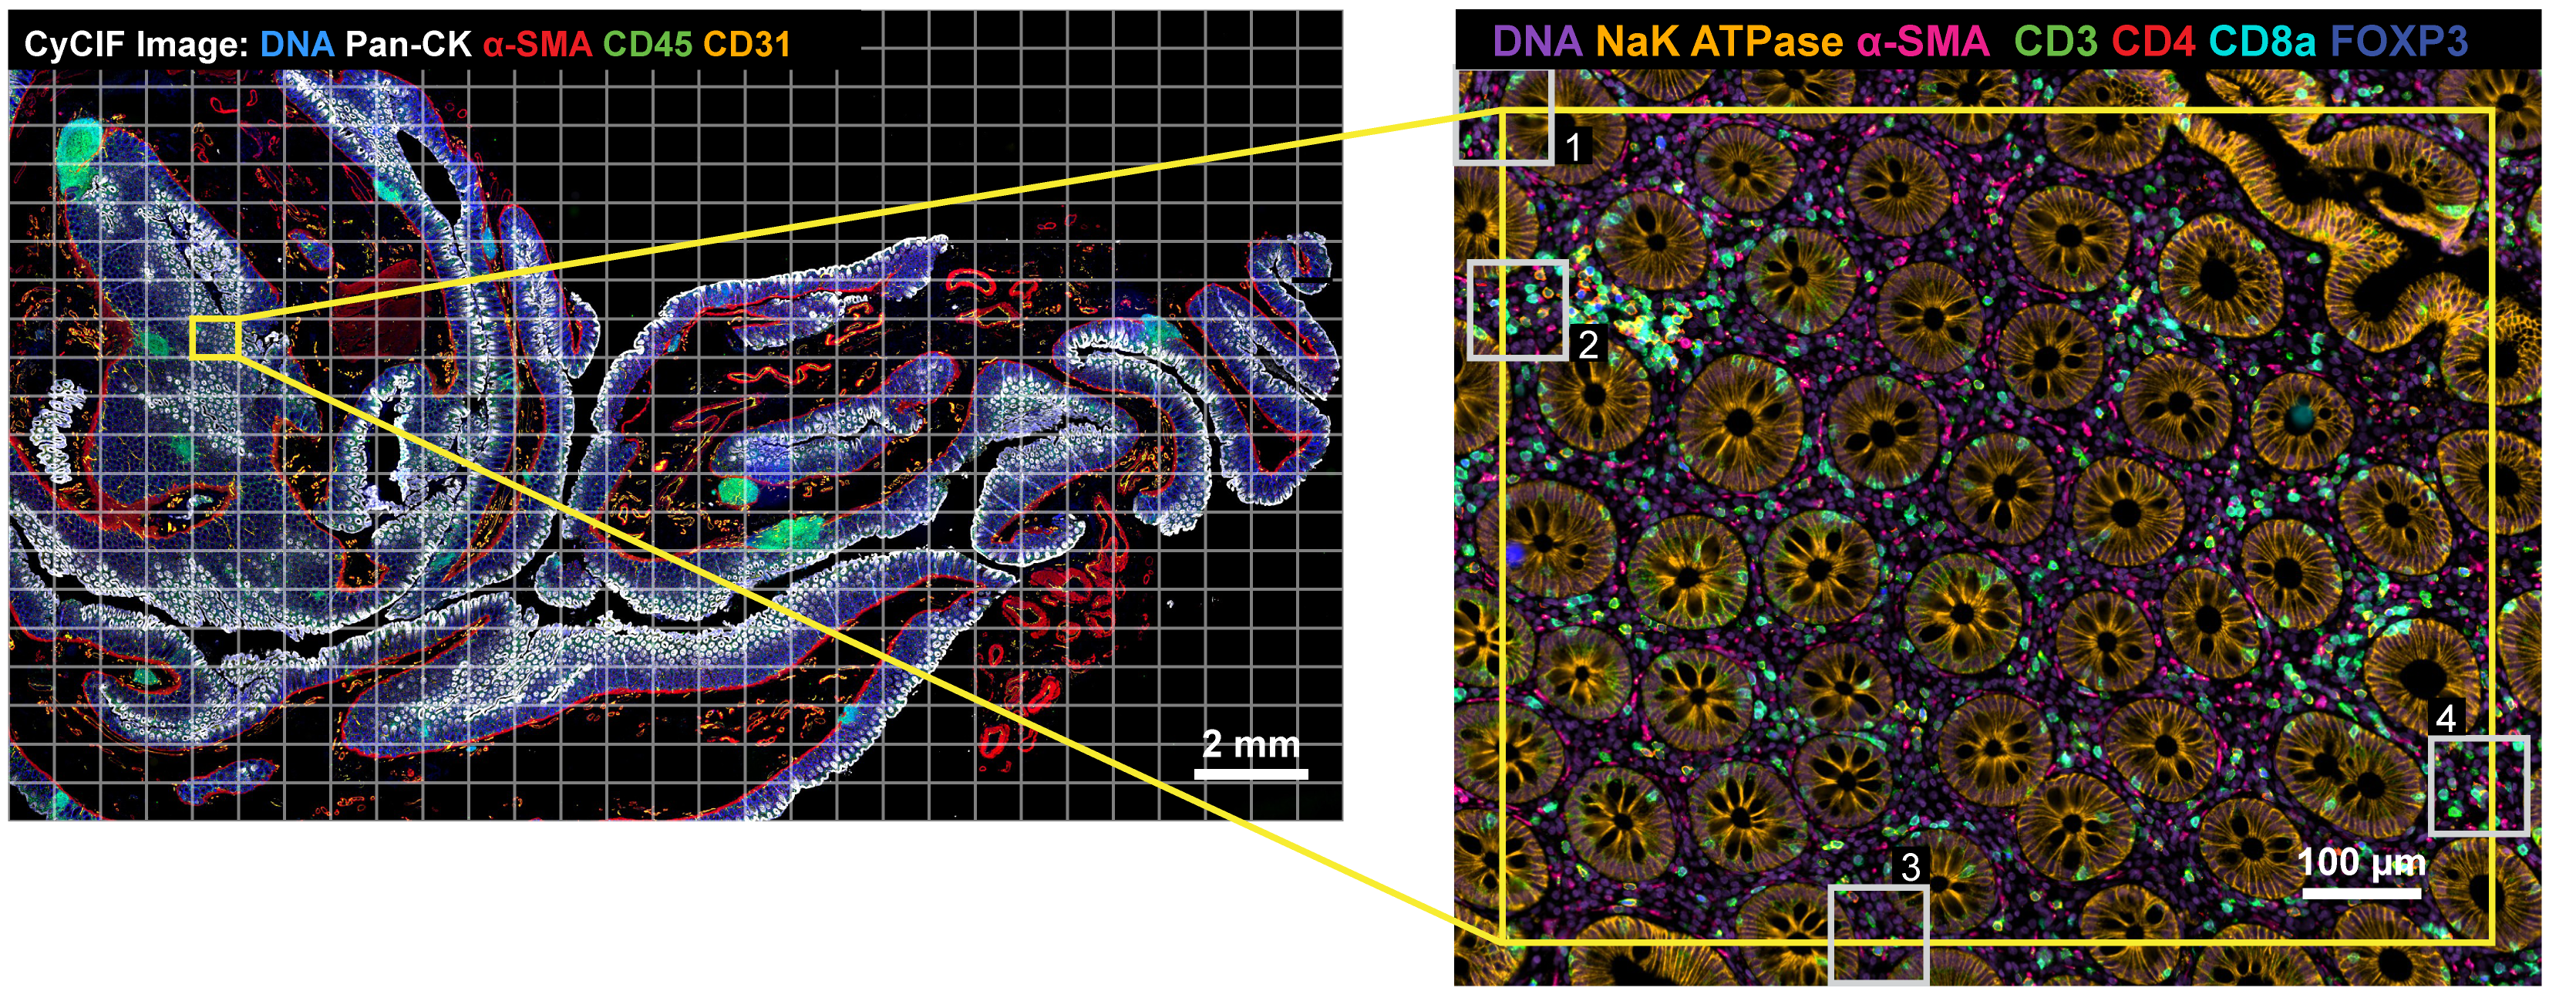
The following images show an example mosaic image compiled by ASHLAR from high-plex tissue data. These images represent a ~24 mm x 14 mm x 5 μm section of a human normal colon sample (obtained from the Cooperative Human Tumor Network https://www.chtn.org/). A grid of 609 overlapping tiles (29 x 21) was required to image the entire specimen. Full-resolution insets at tile junctions (shown in the lower row) indicate highly accurate image stitching by ASHLAR.
To test ASHLAR, download the data below and process the data set yourself by following the quick start guide.
Download Example Data on Synapse


Figure 1: ASHLAR mosaic results of a normal human colon*
Upper left: Pseudocolor image showing 5 channels from a 28-plex (9-cycle) t-CyCIF image of a normal human colon section. Tiles, denoted by the gray grid, overlapped by ~31 pixels (20 μm).
Upper right: Higher magnification view of the area surrounding a single tile showing 7 channels from 4 different cycles to highlight stitching and registration accuracy.
Lower panels: Regions of the tile overlap area at full resolution. Insets correspond to the white box with the matching number in the upper right panel.
Note that the higher magnification panels (upper right and lower row) feature different antibodies than the lower magnification panel (upper left) to highlight structures relevant at each spatial scale.
*The representative images above only depict a subset of the full list of image channels present in the data set.*

