Detect Tertiary Lymphoid Structures using a KNN-density approach
detect_TLS.RdIdentifies TLS candidates by finding regions of high local B-cell density
that also contain a sufficient number of nearby T cells (B+T
co-localisation). Phenotype labels "B cell" and "B cells"
(and their T-cell equivalents) are both accepted.
Usage
detect_TLS(
  LSP,
  ldata,
  k = 30L,
  bcell_density_threshold = 10,
  min_B_cells = 50L,
  min_T_cells_nearby = 10L,
  max_distance_T = 50,
  expand_distance = 80
)
Arguments
- LSP
Character. Sample name in
ldata.- k
Integer. Number of nearest neighbours used for density estimation (default
30, calibrated for 0.325 um/px imaging).- bcell_density_threshold
Numeric. Minimum average 1/k-distance (in microns) for a B cell to be considered locally dense (default
15).- min_B_cells
Integer. Minimum B cells per candidate TLS cluster (default
50).- min_T_cells_nearby
Integer. Minimum T cells within
max_distance_Tmicrons of the candidate cluster centre (default30).- max_distance_T
Numeric. Search radius (microns) for T-cell proximity check (default
50).- expand_distance
Integer. The extended values from the boundary of the deteced B-cells clusters that the T cells are bieng integrated (default
80).- ldata
Named list of data frames, or
NULLto use the globalldataobject (deprecated; pass explicitly).
Value
The similarly formatted ldata list, with the data frame for LSP
augmented by three new columns:
tls_id_knnInteger.
0= non-TLS cell; positive integer = TLS cluster ID.tls_center_xNumeric. X coordinate of the TLS centre for TLS cells;
NAotherwise.tls_center_yNumeric. Y coordinate of the TLS centre for TLS cells;
NAotherwise.
Examples
data(toy_ldata)
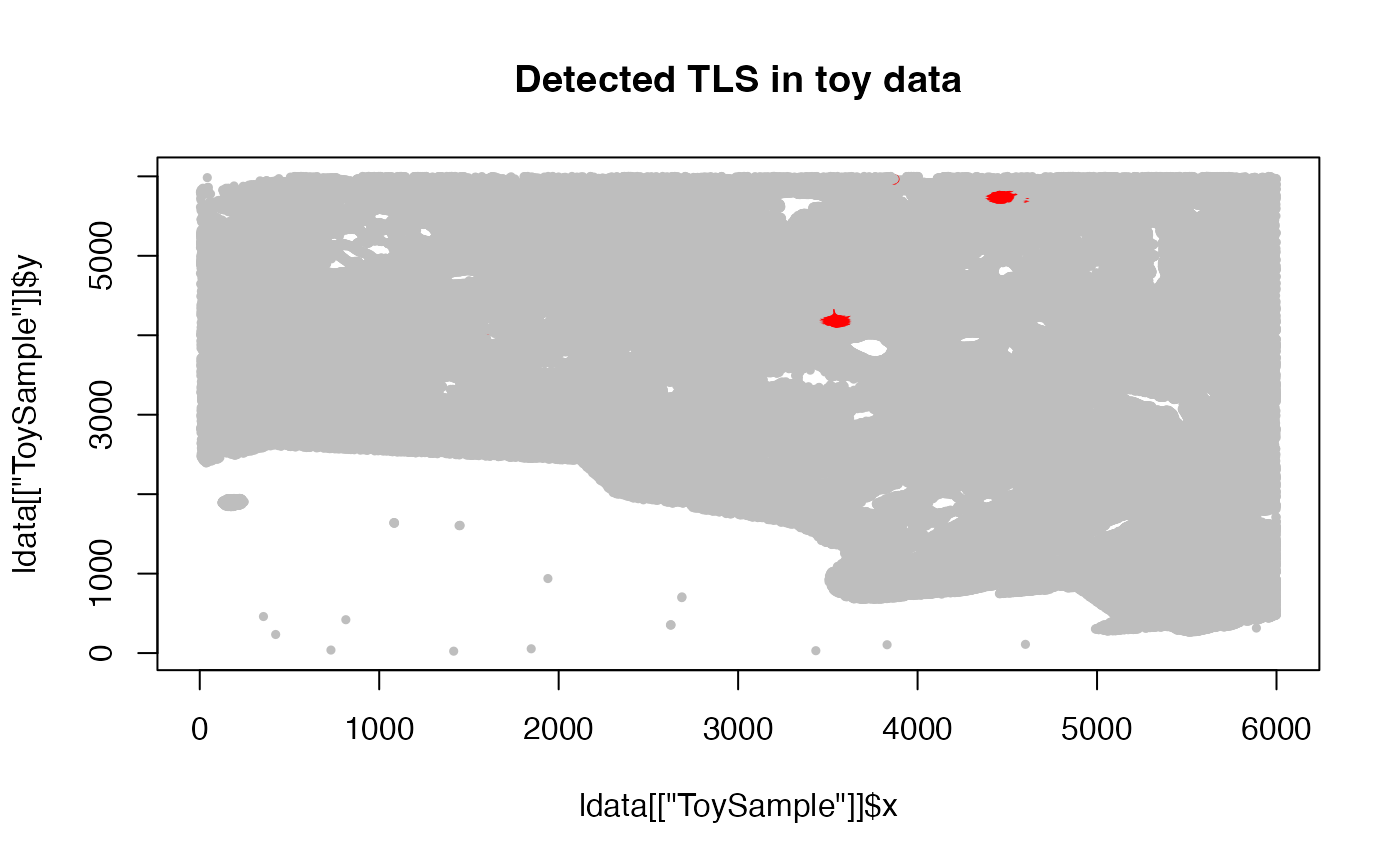
ldata <- detect_TLS("ToySample", k = 30, ldata = toy_ldata)
#> Detected TLS: 2
table(ldata[["ToySample"]]$tls_id_knn)
#>
#> 0 1 2
#> 321383 1115 453
plot(ldata[["ToySample"]]$x, ldata[["ToySample"]]$y,
col = ifelse(ldata[["ToySample"]]$tls_id_knn > 0, "red", "gray"),
pch = 19, cex = 0.5, main = "Detected TLS in toy data")