HTA MEL Atlas 1
The HTA MEL Atlas 1 dataset contains images and other data being used for construction of an atlas of human melanoma under the auspices of the Human Tumor Atlas Network. Advanced solid cancers are complex assemblies of tumor, immune, and stromal cells that invade adjacent tissue and spread to distant sites. We use highly multiplexed tissue imaging, spatial statistics, and machine learning to identify cell types and states underlying morphological features of known diagnostic and prognostic significance in melanoma. This includes the tumor invasive margin, where tumor, normal, and immune cells compete and were diverse immunosuppressive environments are found.
Contents
Data overviews
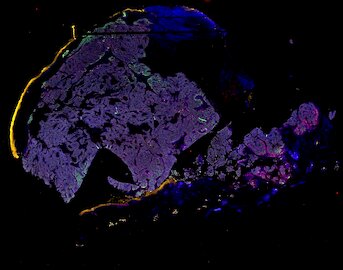
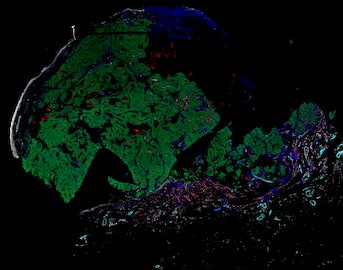
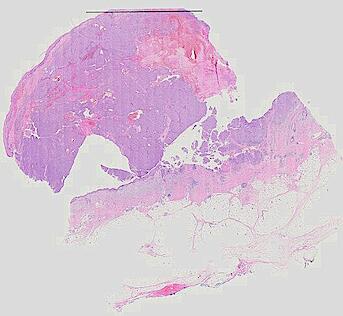
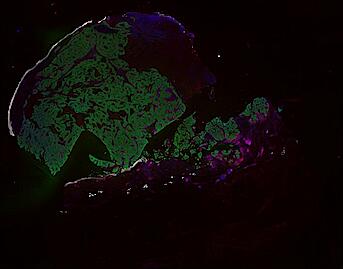
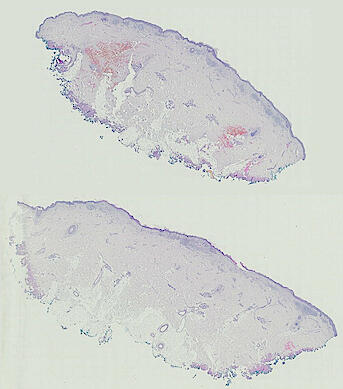
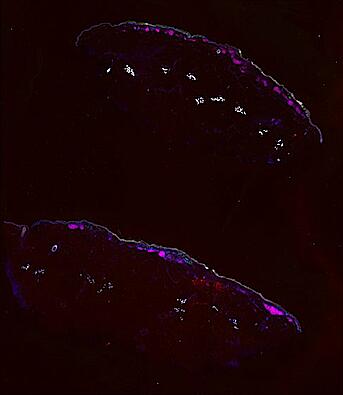
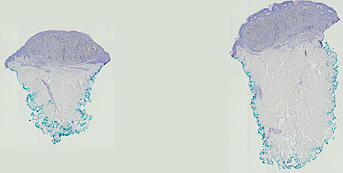
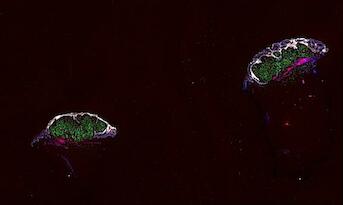
NOTE! These Data Overviews provide access to minimally processed Level 2 images with no annotation or quality control. Click any of the following thumbnail images for an interactive view of the full-resolution images.
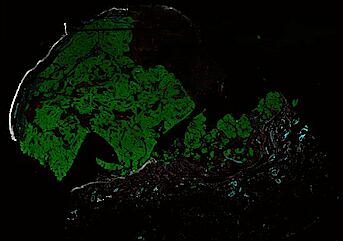
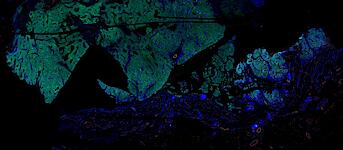
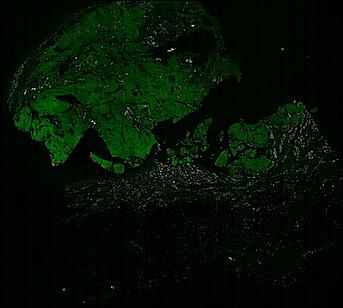
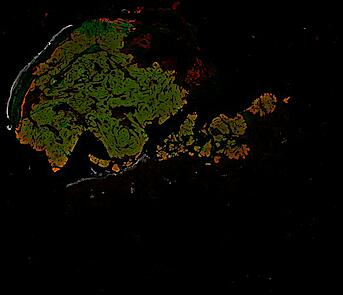
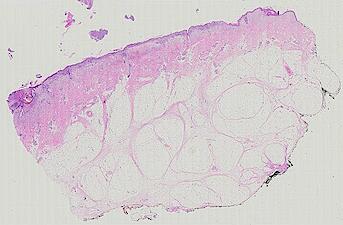
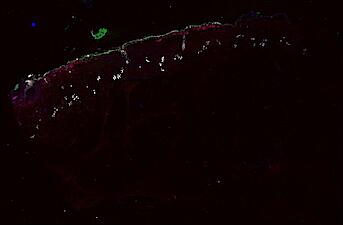
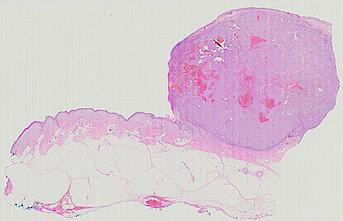
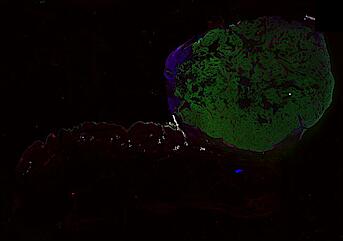
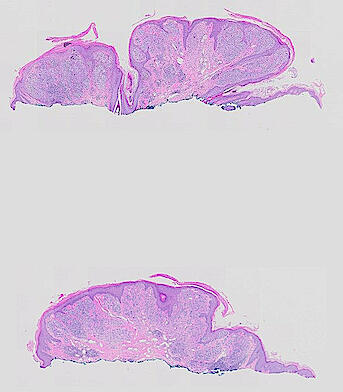
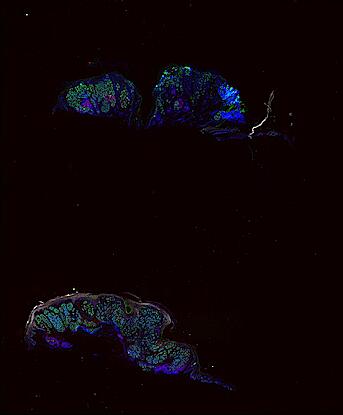
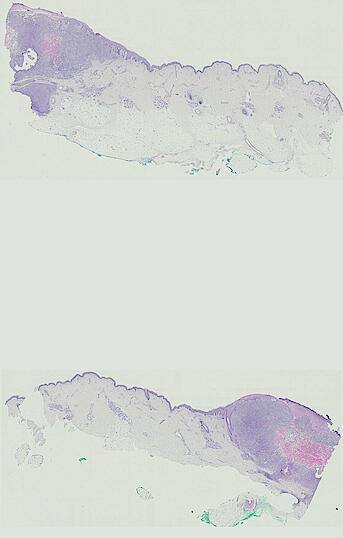
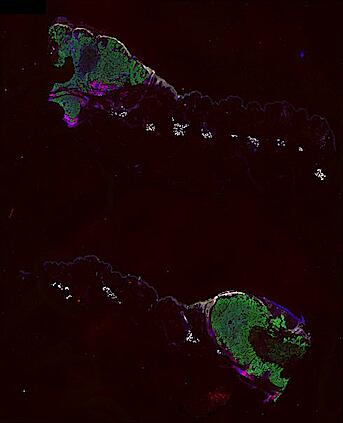
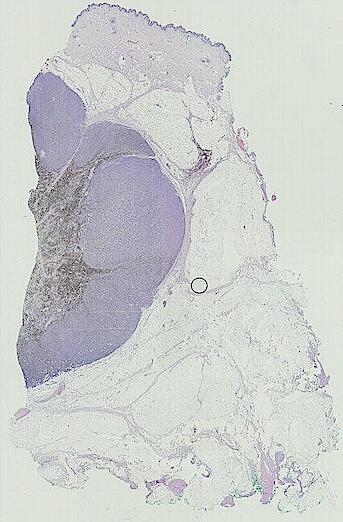
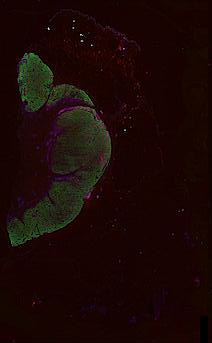
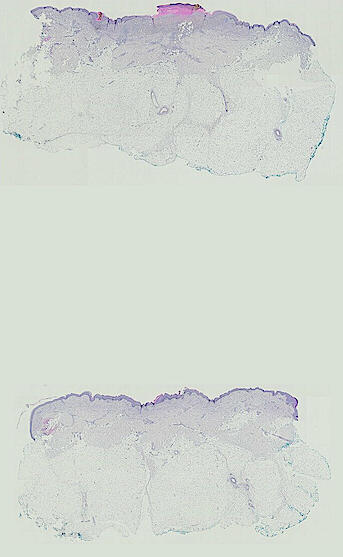
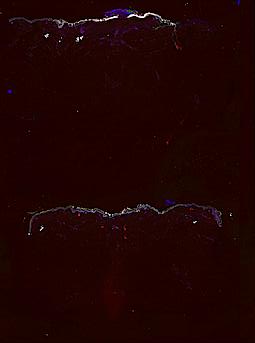
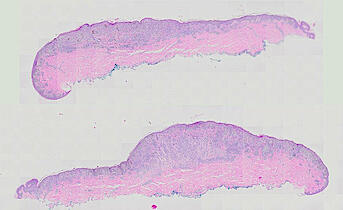
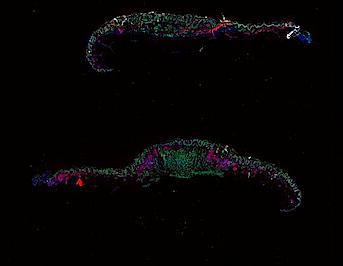
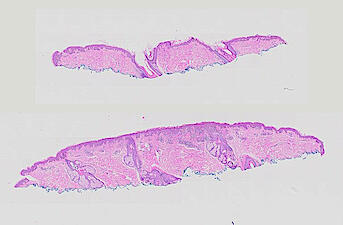
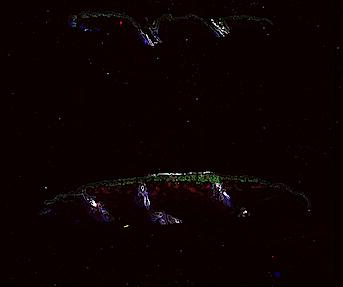
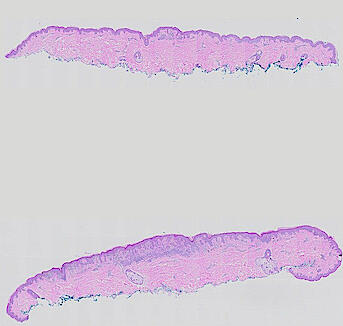
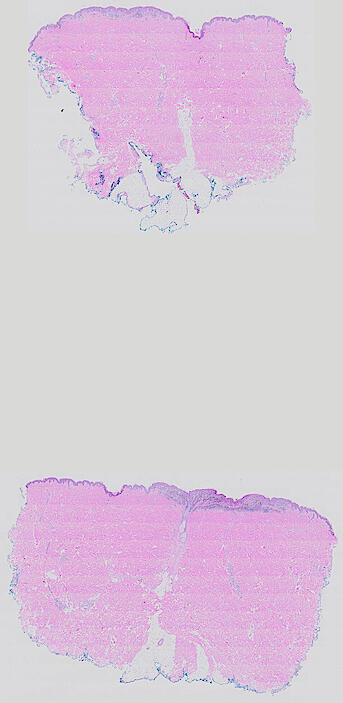
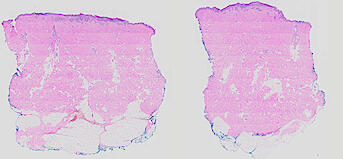
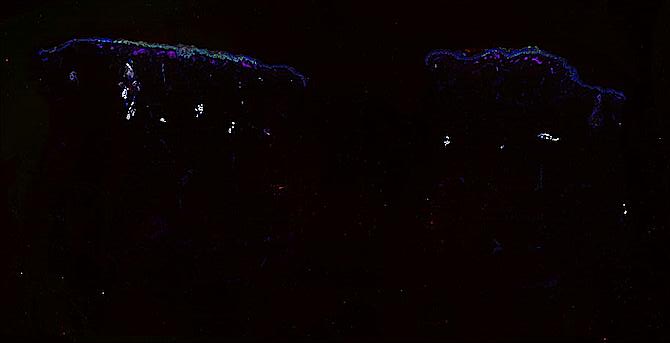
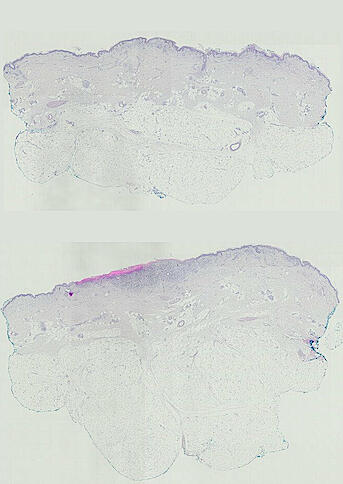
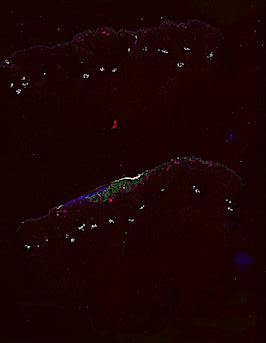
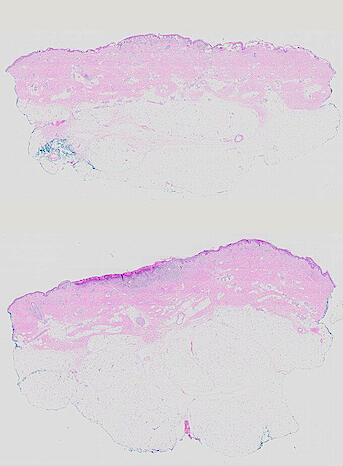
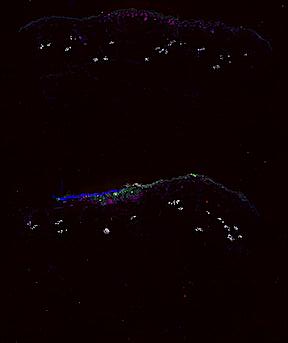
Data Explorations
About Minerva
Exploring the primary image data in Nirmal et al.
The images in Nirmal et al. (2021) comprise a ~2.3 TB dataset with some images as large as 1 gigapixel. We provide access to this information without restriction (as required by the NCI Moonshot effort) but it is not in a convenient form for reviewers or general users to explore. The open source Minerva software was designed for the Human Tumor Atlas Network (HTAN) by the Laboratory of Systems Pharmacology to address this problem.
Minerva enables intuitive real-time exploration of very large (gigapixel) high-plex images in the cloud using a web browser. With Minerva, users can pan around and magnify areas of an image and switch between channels. Minerva does not require the installation of any software and is therefore secure; browsing is also anonymous. Users interested in the tool are welcome to explore the documentation, the software publication, and a description of digital docents in general.
We provide two types of Minerva stories with this paper:
- “Data Overviews” provide access to minimally processed Level 2 images with annotation and interpretation kept to a bare minimum.
- “Data Explorations” are like museum guides and exploit the digital docents in Minerva to guide readers through the complexities of a large image dataset via a series of narrated stories and waypoints. Both written and audio narration are supported, as well as free exploration. These will be linked to individual figure panels in the final manuscript.
